Recently, Warren Buffett’s Berkshire Hathaway Inc raised its stakes in Mitsubishi Corp and Mitsui & Co, according to company filings, prompting a sharp rally in trading house shares. Berkshire increased its holding in Mitsubishi to 10.23% of voting rights, up from 9.74% in March, while Mitsui confirmed Buffett’s group had also lifted its stake to just under 10%. The announcement lifted Mitsubishi’s shares by nearly 3% and Mitsui by 1.8% as investors welcomed the show of confidence. (Source: The Edge)
Berkshire’s additional purchases signal not only confidence in Japan’s trading houses, but also highlight the structural appeal of these sprawling conglomerates. Known locally as sōgō shōsha, the big five—Mitsui, Mitsubishi, Itochu, Marubeni, and Sumitomo—control vast businesses that span the essentials of daily life, from food and clothing to housing and transportation. Their portfolios cover overseas oil and gas production, metals, chemicals, salmon farming, and even retail convenience stores. In short, they sit at the heart of “衣食住行” (the pillars of daily living).
From 2020 Origins to Spotlight on Japan
This latest increase builds on Buffett’s 2020 decision to acquire 5% stakes in each of the five trading houses. At the time, the move surprised markets, as Berkshire had seldom ventured meaningfully into Japan. Buffett explained that the appeal lay in their global reach, diversified earnings streams, and conservative financial management. Since then, his stakes have gradually risen toward 10%, aided by relaxed agreements with the companies.
That 2020 bet has since turned into a spotlight moment for Japanese equities. Shares in the trading houses have outperformed, while global investors have grown more attentive to Japan’s market. Buffett’s vote of confidence has dovetailed with ongoing corporate governance reforms and rising shareholder returns, making Japan a more compelling allocation within global portfolios.
Japan in the Global Index Context
Within the MSCI World Index, Japan accounts for about 5.29% of market capitalization, far smaller than the U.S. but still significant as the second-largest country weight. In the MSCI Asia Pacific Index, Japan is far more dominant, representing about 30.40% as of July 2025—larger than China or Australia. Japanese equities in these benchmarks are tilted toward automotive (Toyota Motor Corp), financials (Mitsubishi Ufj Financial Grp), consumer (Sony Group Corp) and industrials (Hitachi) sectors, reflecting the country’s mix of export-driven manufacturers, banks, and diversified conglomerates. This contrasts with the U.S.-centric global index, which is dominated by technology stocks. For context, in the MSCI World Index, a single U.S. stock — Nvidia at 5.69% — now outweighs the entire Japanese market at 5.29%.
Market Outlook: Opportunities and Risks
Japan’s equity market has been trading near all-time highs in 2025, with the Nikkei 225 surpassing levels last seen in the late 1980s bubble era. Several factors have supported this rally:
Opportunities / Tailwinds
- Corporate governance reforms: Pressure from the Tokyo Stock Exchange has encouraged firms to improve capital efficiency. Many companies have boosted dividends and buybacks, enhancing shareholder appeal.
- Weak yen and exports: The yen’s depreciation has lifted earnings for exporters such as automakers and electronics makers, reinforcing Japan’s competitive edge globally.
- Global liquidity: Expectations of a more dovish Federal Reserve have supported risk sentiment and foreign inflows into Japan, seen as a relatively under-owned market.
- Economic resilience: GDP growth has surprised on the upside, helped by stronger domestic consumption and investment. Japan’s economy expanded 0.3% quarter-over-quarter in the second quarter of 2025. On a year-over-year basis, Japan’s GDP expanded 1.2% in the second quarter.
Risks / Headwinds
- Monetary policy shift: The Bank of Japan is moving cautiously toward policy normalization. Any sharper-than-expected tightening could weigh on equity valuations and investor appetite.
- Fiscal constraints: Japan’s already high public debt leaves limited room for large-scale stimulus if growth slows. Political shifts also add uncertainty to fiscal direction. To recall, just about a week ago, Japan’s 20-year bond yield rose to 2.655%, the highest since 1999, while the 30-year hit 3.185%. Foreign purchases of bonds over 10 years fell to ¥480b in July, just one-third of June’s level, heightening steepening risks.
- External risks: As an export-heavy economy, Japan remains vulnerable to a global slowdown, trade tensions, or weakening demand from key partners such as China and the U.S.
- Valuations: While still lower than U.S. peers, Japanese equities have re-rated significantly. Without continued reform momentum, valuations could cap further gains.
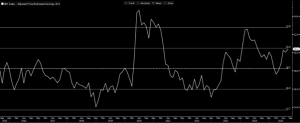
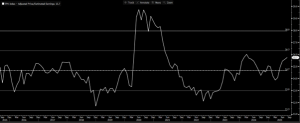
The Nikkei 225 Index is trading at 20.4x forward P/E, about 1 standard deviation above its 10-year average, while the Topix Index stands at 15.7x, 0.7 standard deviation above its 10-year mean. Valuations appear stretched unless earnings can catch up significantly. Bloomberg consensus currently forecasts earnings growth of 12.53% for the Nikkei 225 Index and 10.65% for the Topix Index in 2026.
Figure 1: Nikkei 225 Index 10-year P/E Chart

Source: Bloomberg, 28 August 2025
Figure 2: Topix Index 10-year P/E Chart

Source: Bloomberg, 28 August 2025
Investors seeking Japan exposure can consider our Managed UT Portfolio, which includes PMART UT, PMA UT, and PMART UT Flexi for targeted investment opportunities. Our portfolio is available in both Conventional and Shariah options. Separately, our platform also offers selected UT funds with exposure to Japan-focused strategies.
Please click on the link to learn more or email us at cse.my@phillipcapital.com.my if you require any further information.
Disclaimer
The information contained herein does not constitute an offer, invitation, or solicitation to invest in any product or service offered by Phillip Capital Management Sdn Bhd (“PCM”). No part of this document may be reproduced or circulated without prior written consent from PCM. This is not a unit trust or collective investment scheme and is not an obligation of, deposit in, or guaranteed by PCM. All investments carry risks, including the potential loss of principal.
Performance figures presented may reflect model portfolios and may differ from actual client accounts’ performance. Variations in individual clients’ portfolios against model portfolios and between one client’s portfolio to another can arise due to multiple factors, including (but not limited to) higher relative brokerage costs for smaller portfolios, timing of capital injections or withdrawals, timing of purchases and sales, and mandate change (e.g., Shariah vs. conventional). These differences may impact overall performance.
Past performance is not necessarily indicative of future returns. The value of investments may rise or fall, and returns are not guaranteed. PCM has not considered your investment objectives, financial situation, or particular needs. You are advised to consult a licensed financial adviser before making any investment decisions.
While all reasonable care has been taken to ensure the accuracy and completeness of the information contained herein, no representation or warranty is made, and no liability is accepted for any loss arising directly or indirectly from reliance on this material. This publication has not been reviewed by the Securities Commission Malaysia.


