

Emotions play a significant role in our decision-making processes, and when it comes to investing, they can have a profound impact on our ability to make rational choices. Emotions such as fear, greed, and overconfidence can cloud rational judgment and lead to irrational investment decision-making. In our previous article, we shared one of the most common emotional responses that affect investment decisions is the fear of missing out (FOMO), which can cause individuals to buy high and sell low. Some investors may cling onto lost stocks for a long time in the hopes that the price will rise if they are unwilling to cut their losses. While it is natural to hope for a rebound in stock prices, the reality is that some stocks may never recover, and waiting too long to sell can lead to significant losses.
We also shared 5 tips how investors could keep their emotions out of the way, which include:
- Understand what you are investing and invest with fundamentals
- Proper goal setting
- Investors should invest with data, not emotions.
- Sufficient liquidity
- Engage with a professional investment firm to assist with your investment decisions
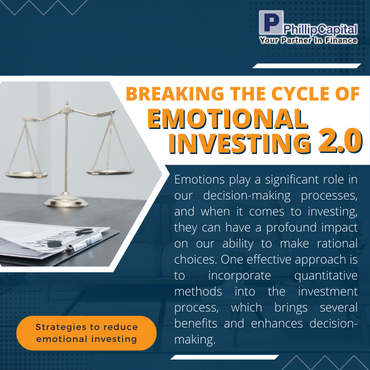
Of course, the list is not exhaustive and there are numerous strategies available to help us minimise the impact of emotions on our investment decision-making process. One effective approach is to incorporate quantitative methods into the investment process, which brings several benefits and enhances decision-making. Quantitative methods in investing rely on data-driven analysis rather than subjective interpretation. They have the ability to identify patterns and trends that may not be easily observable to the human eye. By providing a systematic approach, quantitative methods help reduce the impact of emotions on investment decisions, resulting in a more consistent investment performance.
Quantitative models have demonstrated success in stock selection, with one notable example being the Dogs of the Dow model. The “Dogs of the Dow” is a quantitative investment strategy that aims to identify undervalued stocks for potential long-term gains. It is based on the concept of selecting the highest dividend-yielding stocks from the Dow Jones Industrial Average (DJIA), which is an index comprised of 30 large, blue-chip companies.
The “Dogs of the Dow” strategy involves selecting a specific number of stocks, typically 10, from the DJIA. Once these ten “Dogs of the Dow” stocks are identified, an investor typically allocates an equal amount of money to each of them. The underlying rationale is that these high-yielding stocks, which are temporarily out of favour, have the potential to bounce back and generate attractive returns. The strategy aims to benefit from both potential capital appreciation and dividend income. By focusing on high dividend yields, the “Dogs of the Dow” strategy seeks to generate income through regular dividend payments. This income can act as a cushion during market downturns, providing some stability to the overall investment portfolio.
PMART Dividend Enhanced and PMA Dividend Enhanced
Our PMART Dividend Enhanced and PMA Dividend Enhanced is an income-driven portfolio focused on high dividend-yielding equities. We apply the Dog of the Dow approach, screen and select top market cap stocks to minimise risk and ensure consistent performance. The portfolio is an equal weighting portfolio which reduces concentration risk and provides similar exposure to all clients, both initially and after rebalancing. We offer both conventional and Shariah investment options to cater to the diverse needs of our investors.
Why PMART Dividend Enhanced and PMA Dividend Enhanced
- Selecting top market cap stocks minimises the unsystematic risk and liquidity risk.
These stocks belong to well-established companies that have demonstrated stability and success in the market over years. By investing in these stocks, investors are, likely, able to reduce the risk associated with individual companies or sectors, as they are less likely to be affected by company-specific issues. Additionally, top market cap stocks are more liquid, meaning there is a higher volume of shares available for trading. This increased liquidity reduces the risk of not being able to buy or sell shares at desired prices, making it easier to enter or exit positions.
- Disciplined and systematic, following a rigorously backtested strategy.
Our Dividend Enhanced mandates follow a disciplined and systematic approach by rebalancing on the first business day of each month. We utilise the “Dog of the Dow” principles, selecting the highest yielding dividend stocks from a stock universe comprising top market cap stocks listed on Bursa Malaysia. To ensure accuracy, we rely on data and estimates sourced from Bloomberg. Our investment strategy incorporates the use of the Phillip Proprietary Quant Model, implemented through Python, and the results are rigorously backtested. This process allows us to evaluate the performance of our strategy based on data and make any necessary adjustments to ensure its effectiveness.
- Minimal human interventions bringing about more consistent results.
We explored how emotions can often interfere with rational decision-making in investment. In contrast, our Dividend Enhanced mandates are designed to minimise human interventions and rely on a disciplined and systematic approach. By following predetermined rules and guidelines, our investment strategy aims to remove emotional biases from the decision-making process. Furthermore, this approach eliminates the temptation to make impulsive changes based on short-term market movements or emotional reactions, hence achieving more consistent results over time.
- Income driven focused product generating returns from capital appreciation and income distribution from selecting advantageous dividend yields.
By focusing on companies that offer attractive dividend yields, we seek to provide investors with a reliable stream of income while also benefiting from potential long-term price appreciation. Our proprietary quantitative models and disciplined investment process ensure that we identify companies with strong financials and a history of consistent dividend payouts, maximizing the potential for generating returns from both capital appreciation and income distribution.
Resilience Performance
Despite challenging market conditions, the performance of our PMART Dividend Enhanced and PMA Dividend Enhanced demonstrated remarkable resilience. The Conventional mandate was able to register positive returns of +4.60% YTD, outperforming its benchmark by +12.54%. Meanwhile, the Shariah mandate achieved a +2.73% of growth YTD, outperforming its benchmark by +7.52%. This can be attributed to our portfolio’s focus on high-quality companies that possess defensive earnings profiles and exhibit promising dividend prospects and yields.
Figure 3: Performance of Dividend Enhanced (Conventional) Mandate

Source: PCM, accurate as of 30 June 2023
Figure 4: Performance of Dividend Enhanced (Shariah) Mandate

Source: PCM, accurate as of 30 June 2023
Figure 5: List of companies in Conventional Mandate
| Companies | Sector | 12mth Historical Yield (%) | 12mth Blended Forward Yield (%) |
| TIME DOTCOM BHD | Communication Services | 16.43 | 9.07 |
| BRITISH AMERICAN TOBACCO BHD | Consumer Staples | 8.27 | 8.16 |
| RHB BANK BHD | Financials | 7.37 | 7.89 |
| MALAKOFF CORP BHD | Utilities | 9.05 | 7.64 |
| MALAYAN BANKING BHD | Financials | 6.72 | 7.31 |
| ASTRO MALAYSIA HOLDINGS BHD | Communication Services | 6.25 | 7.21 |
| ALLIANCE BANK MALAYSIA BHD | Financials | 6.61 | 6.86 |
| PAVILION REAL ESTATE INVEST | REITS | 6.40 | 6.71 |
| GAS MALAYSIA BHD | Utilities | 7.59 | 6.64 |
| AFFIN BANK BHD | Financials | 16.16 | 6.59 |
| IGB REAL ESTATE INVESTMENT T | REITS | 6.08 | 6.54 |
| UOA DEVELOPMENT BHD | Property | 6.41 | 6.41 |
| GENTING MALAYSIA BHD | Consumer Discretionary | 6.10 | 6.21 |
| SUNWAY REAL ESTATE INVESTMEN | REITS | 5.91 | 6.18 |
| SIME DARBY BERHAD | Industrials | 5.12 | 5.77 |
Source: PCM, accurate as of 30 June 2023
Figure 6: List of companies in Shariah Mandate
| Companies | Sector | 12mth Historical Yield (%) | 12mth Blended Forward Yield (%) |
| TIME DOTCOM BHD | Communication Services | 16.43 | 9.07 |
| TALIWORKS CORP BHD | Utilities | 8.10 | 8.34 |
| MALAKOFF CORP BHD | Utilities | 9.05 | 7.64 |
| MATRIX CONCEPTS HOLDINGS BHD | Property | 5.85 | 7.09 |
| BERMAZ AUTO BHD | Consumer Discretionary | 6.95 | 6.78 |
| BANK ISLAM MALAYSIA BHD | Financials | 1.74 | 6.72 |
| GAS MALAYSIA BHD | Utilities | 7.59 | 6.64 |
| TA ANN HOLDINGS BERHAD | Consumer Staples | 11.98 | 6.54 |
| UOA DEVELOPMENT BHD | Property | 6.41 | 6.41 |
| ECO WORLD DEVELOPMENT GROUP | Property | 6.17 | 6.17 |
| SIME DARBY BERHAD | Industrials | 5.12 | 5.77 |
| UCHI TECHNOLOGIES BHD | Information Technology | 8.70 | 5.72 |
| RCE CAPITAL BHD | Financials | 13.57 | 5.71 |
| KLCCP STAPLED GROUP | REITS | 5.51 | 5.60 |
| AXIS REAL ESTATE INVESTMENT | REITS | 3.73 | 5.35 |
Source: PCM, accurate as of 30 June 2023
Please click on the link to learn more or email us at cse.my@phillipcapital.com.my if you require any further information.
Disclaimer:
The information contained herein does not constitute an offer, invitation or solicitation to invest in Phillip Capital Management Sdn Bhd (“PCM”). This article has been reviewed and endorsed by the Executive Director (ED) of PCM. This article has not been reviewed by The Securities Commission Malaysia (SC). No part of this document may be circulated or reproduced without prior permission of PCM. This is not a collective investment scheme / unit trust fund. Any investment product or service offered by PCM is not obligations of, deposits in or guaranteed by PCM. Past performance is not necessarily indicative of future returns. Investments are subject to investment risks, including the possible loss of the principal amount invested. Investors should note that the value of the investment may rise as well as decline. If investors are in any doubt about any feature or nature of the investment, they should consult PCM to obtain further information including on the fees and charges involved before investing or seek other professional advice for their specific investment needs or financial situations. Whilst we have taken all reasonable care to ensure that the information contained in this publication is accurate, it does not guarantee the accuracy or completeness of this publication. Any information, opinion and views contained herein are subject to change without notice. We have not given any consideration to and have not made any investigation on your investment objectives, financial situation or your particular needs. Accordingly, no warranty whatsoever is given and no liability whatsoever is accepted for any loss arising whether directly or indirectly as a result of any persons acting on such information and advice.


