Amid global market volatility, characterized by concerns over a potential recession, China’s economic slowdown, and ongoing trade tensions between the East and the West, ASEAN has emerged as a beacon of stability. The MSCI ASEAN Index has delivered a notable 13% return year-to-date as of September 12, 2024. Examining the breakdown further, Malaysia has emerged as the top performer year-to-date (including dividends) with a return of 16.38%, followed by Singapore at 14.71% and Vietnam at 11.97% (see Exhibit 1).
Exhibit 1: ASEAN Market Performance YTD
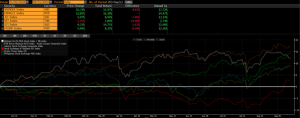
Source: Bloomberg, 12 Sep 2024
Recent improvements in risk sentiment, driven by a more moderate slowdown in US growth and gradual disinflation, have led to a weakening of the USD. As we approach the end of the year and move into the next, we anticipate that risk sentiment in the ASEAN region will continue to strengthen. This is premised on the reasons below:
- ASEAN demonstrates strong economic growth potential
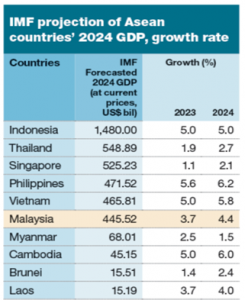
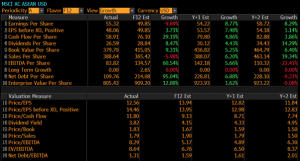
Following a moderate 2023, ASEAN is projected to experience robust economic growth in 2024, according to IMF forecasts. This growth will be primarily driven by the Philippines (6.2%), Cambodia (6.0%), Vietnam (5.8%), and Indonesia (5.0%). Separately, Malaysia is anticipated to grow at a rate of 4.4% (see Exhibit 2). Economic growth is crucial because it directly impacts earnings growth of the corporates. Economic expansion boosts consumer demand and sales, leading to higher revenues and profits for businesses. It also improves investment opportunities and market conditions, creating a favorable environment for corporate earnings growth. According to Bloomberg estimates, MSCI ASEAN Index is expected to see 8.77% and 8.29% earnings growth in 2025F and 2026F respectively (see Exhibit 3). The resilient earnings growth will be supportive of the market performance, in our view.
Exhibit 2: IMF Projection of ASEAN countries’ 2024 GDP Growth
Source: The Edge, IMF
Exhibit 3: Resilient earnings growth expected for ASEAN
Source: Bloomberg, 12 Sep 2024
- An anticipated shift in US Fed policy is generally beneficial for the ASEAN market
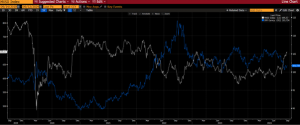
Lower interest rates or a more dovish stance from the Fed can reduce borrowing costs and increase liquidity, which may boost investor confidence and capital flows into emerging markets like ASEAN. Additionally, a weaker US dollar resulting from a Fed pivot can make ASEAN exports more competitive and attract investment. Overall, these factors can create a more supportive backdrop for economic growth and market performance in the ASEAN region. Historically, ASEAN markets perform well in a weak dollar environment, as evidenced by the inverse relationship between the DXY Index and the MSCI ASEAN Index (see Exhibit 4). Countries such as Indonesia, the Philippines, Thailand, and Malaysia have experienced net foreign inflows into their markets, particularly from Q3 onward, as the dollar began to weaken during this period (see Exhibit 5).
Exhibit 4: DXY and MSCI ASEAN Index
Source: Bloomberg, 12 Sep 2024
Exhibit 5: Net Foreign Fund Flows into Equity by Market

Source: MIDF, 9 Sep 2024
- ASEAN remains a favourite destination for FDIs
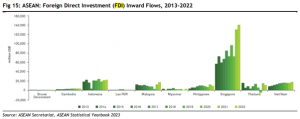
ASEAN economies, known for their openness to international trade, have benefited from a surge in electronics exports and manufacturing activity. The region, particularly Singapore, Vietnam, Malaysia, and Thailand, is highly trade-sensitive, while Indonesia and the Philippines, with their larger domestic markets, are less affected. The rising demand for semiconductors, growth in the EV sector, and increased FDI driven by shifting manufacturing supply chains enhance ASEAN’s position in global trade recovery. Despite a 2% global decline in FDI to USD 1.3 trillion in 2023, ASEAN saw a slight increase in inward FDI flows, totaling USD 229.8 billion, up 0.3% from 2022. Singapore remained the top recipient with USD 159.6 billion, followed by Indonesia and Vietnam. The region’s resilience and attractiveness to investors are bolstered by supply chain relocations and tariff arbitrage amid US-China rivalry. Key FDI sources include the US, Japan, the EU, and China, focusing on finance, manufacturing, real estate, and trade. Hence, the long term prospect for ASEAN remains bright and solid.
Exhibit 6: Key charts related to FDIs

Source: Maybank Research, 10 Sep 2024
- Valuation remains attractive despite the recent run-up
MSCI ASEAN Index is currently trading at 13.6x P/E, one standard deviation below the 10-year historical mean.
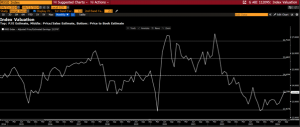
Source: Bloomberg, 12 Sep 2024
In summary, we are optimistic about the ASEAN market’s outlook. We hold a positive view on Malaysia, driven by recent policy initiatives like the MADANI Economy Framework, National Semiconductor Strategy, Johor-Singapore SEZ, and advances in renewable energy exports. Thailand’s relative political stability post-government formation and Indonesia’s upcoming presidential transition with Prabowo taking office on October 20 also contribute to our optimism. Singapore is consistently regarded as a safe haven due to its policy stability. For the Philippines, factors such as peaking inflation, anticipated food price declines, potential policy rate cuts, capital market reforms, and the midterm elections in Q2 2025, which are expected to boost consumer spending, support a favorable outlook. Finally, we are increasingly positive on Vietnam, given its currently low valuation. The country is poised to benefit from strong economic growth and substantial net FDI inflows. A potential upgrade from a frontier to an emerging market could serve as a major catalyst.
Investors seeking ASEAN exposure can consider our Managed UT Portfolio, which includes PMART UT, PMA UT, and PMART UT Flexi for targeted investment opportunities. We continue to hold an overweight position in Malaysia while maintaining some ASEAN exposure for diversification purposes. The percentage difference in allocations is due to the varying weightages of the selected funds and the availability of fund options within the universe.
| In % | Allocation (Malaysia) | Allocation (ASEAN ex Malaysia) |
| PMART UT | ||
| Conventional Conservative | 35.5 | 2.1 |
| Conventional Aggressive | 34.3 | 2.6 |
| Shariah Conservative | 35.2 | 2.7 |
| Shariah Aggressive | 37.4 | 2.1 |
| PMA UT | ||
| Conventional Conservative | 17.7 | 5.2* |
| Conventional Aggressive | 15.0 | 5.1* |
| Shariah Conservative | 12.4 | 2.3 |
| Shariah Aggressive | 10.1 | 1.5 |
| PMART UT Flexi | ||
| Conventional Conservative | 37.9 | 0.0 |
| Conventional Aggressive | 43.5 | 0.8 |
| Shariah Conservative | 41.7 | 2.1 |
| Shariah Aggressive | 37.2 | 0.6 |
Source: PCM
*Note: Including 4% in Vietnam
Please click on the link to learn more or email us at cse.my@phillipcapital.com.my if you require any further information.
Disclaimer:
The information contained herein does not constitute an offer, invitation or solicitation to invest in Phillip Capital Management Sdn Bhd (“PCM”). This article has been reviewed and endorsed by the Executive Director (ED) of PCM. This article has not been reviewed by The Securities Commission Malaysia (SC). No part of this document may be circulated or reproduced without prior permission of PCM. This is not a collective investment scheme / unit trust fund. Any investment product or service offered by PCM is not obligations of, deposits in or guaranteed by PCM. Past performance is not necessarily indicative of future returns. Investments are subject to investment risks, including the possible loss of the principal amount invested. Investors should note that the value of the investment may rise as well as decline. If investors are in any doubt about any feature or nature of the investment, they should consult PCM to obtain further information including on the fees and charges involved before investing or seek other professional advice for their specific investment needs or financial situations. Whilst we have taken all reasonable care to ensure that the information contained in this publication is accurate, it does not guarantee the accuracy or completeness of this publication. Any information, opinion and views contained herein are subject to change without notice. We have not given any consideration to and have not made any investigation on your investment objectives, financial situation or your particular needs. Accordingly, no warranty whatsoever is given and no liability whatsoever is accepted for any loss arising whether directly or indirectly as a result of any persons acting on such information and advice.


