


When managing a fund, choosing the right benchmark is crucial. Two common approaches are benchmark return and absolute return. Each serves a different purpose and is suited for specific investment goals. Understanding these strategies helps fund managers align their performance evaluation with investor expectations.
Benchmark return compares a fund’s performance to a relevant market index, such as the S&P 500, to assess whether the fund is outperforming or underperforming the broader market. It provides context, helping investors gauge how well a fund is doing relative to its peers.
On the other hand, absolute return focuses on generating positive returns regardless of market conditions. The goal is to achieve consistent profits without comparing performance to an index. This strategy appeals to investors seeking steady returns, often using risk management tools to mitigate losses. The choice between these approaches depends on the fund’s objectives and investor preferences.
This year, the conventional Asia fund outperformed the Islamic Asia fund, primarily due to differences in their respective benchmarks (Table 1). The conventional fund tracks broader market indices, which encompass a wider range of sectors and countries, while the Islamic fund follows Shariah-compliant benchmarks that exclude industries such as alcohol, gambling, and conventional banking. These differences in benchmarks lead to varying country weightings within the portfolios, which in turn affect the fund’s performance.
Table 1: Performance of Selected Asia Funds as of 31 October 2024
| Fund Name | Benchmark | Fund Size (RM’mn) | YTD Return (up to 31 Oct) |
| Conventional | |||
| AHAM Select APAC (ex-Japan) Dividend MYR | MSCI AC Asia Pacific ex Japan Hi Div Yield CR USD | 683.91 | 2.85 |
| AHAM Select Asia (ex Japan) Opportunity MYR | MSCI AC Asia ex Japan CR USD | 670.84 | 5.90 |
| Eastspring Investments Asia Pacific Equity MY | MSCI AC Asia Pacific ex Japan TR USD | 43.59 | 5.00 |
| KAF Jade | MSCI AC Asia Pacific TR USD | 102.56 | 11.28 |
| Kenanga Asia Pacific Total Return | Index is not available on Lipper Database | 181.26 | 7.06 |
| Manulife Investment Asia-Pacific ex Japan | MSCI AC Asia Pacific ex Japan TR USD | 211.68 | 8.73 |
| Principal Asia Pacific Dynamic Growth MYR | Lipper Synthetic Risk Free Rate 9% MYR | 580.63 | 12.07 |
| Principal Asia Pacific Dynamic Income MYR | Lipper Synthetic Risk Free Rate 8% MYR | 3944.32 | 6.52 |
| Principal Asia Titans MYR | MSCI AC Asia ex Japan CR USD | 114.48 | 9.86 |
| Islamic | |||
| AHAM Aiiman Asia (ex Japan) Growth MYR | Dow Jones Islamic Market Asia/Pacific ex Jp TR USD | 145.52 | -0.20 |
| Kenanga Isl Asia Pacific (ex japan) Total Return | Lipper Synthetic Risk Free Rate 8% MYR | 30.34 | 5.25 |
| Manulife Investment Shariah Asia-Pacific ex Japan | FTSE Asia Pacific Ex Japan Shariah TR USD | 225.32 | -1.74 |
| Maybank AsiaPac ex-Japan Equity-I | MSCI AC Asia Pacific Islamic ex Japan TR USD | 264.28 | 7.61 |
| Principal Islamic Asia Pacific Dynamic Equity MYR | MSCI AC Asia ex Japan Islamic TR | 3084.39 | -7.98 |
Source: Lipper, compiled by PCM, 31 October 2024
For example, the MSCI AC Asia Pacific ex Japan Index outperformed the MSCI AC Asia Pacific ex Japan Islamic Index, with returns of 14.42% versus 4.58% as of 31 October 2024. The conventional index is weighted as follows: China (26.27%), Taiwan (18.28%), India (18.07%), Australia (15.33%), South Korea (9.65%), and other countries (12.39%) (Figure 1). In contrast, the Islamic index has the following country weightings: India (26.29%), South Korea (24.01%), Australia (22.9%), China (11.12%), Taiwan (4.84%), and other countries (10.85%) (Figure 2).
Figure 1: MSCI AC Asia Pacific ex Japan Index Country Breakdown
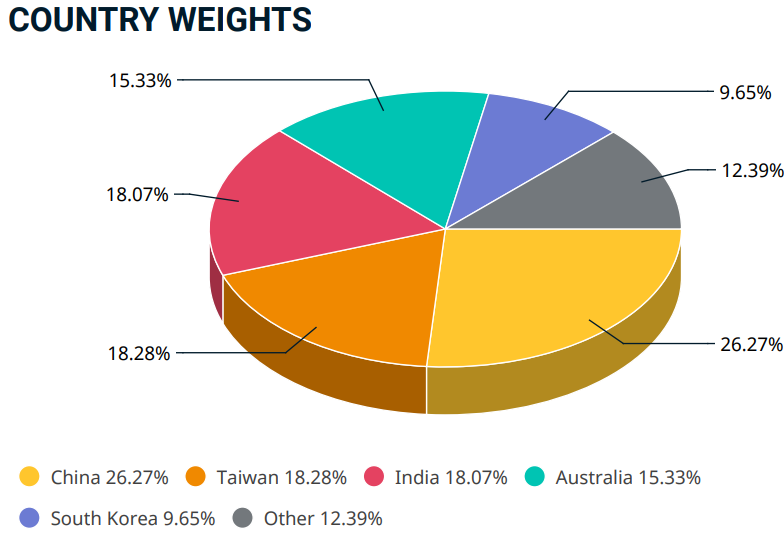
Source: MSCI, 31 October 2024
Figure 2: MSCI AC Asia Pacific ex Japan Islamic Index Country Breakdown
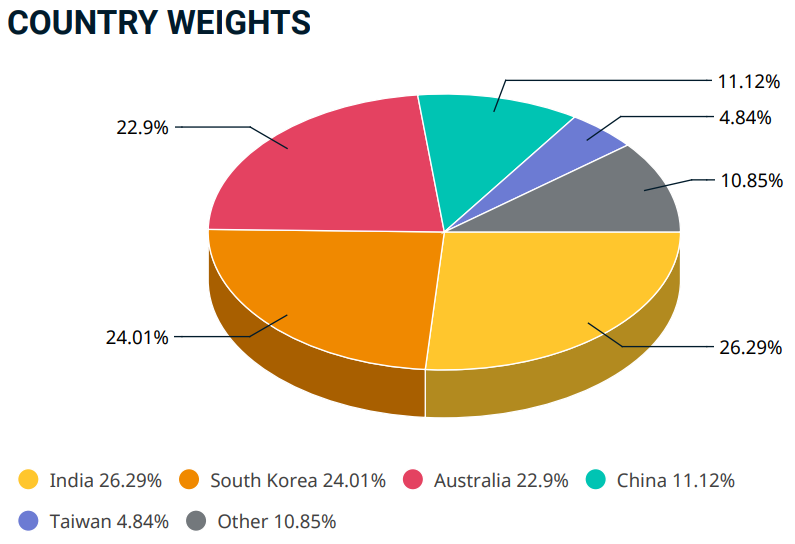
Source: MSCI, 31 October 2024
As of 31 October 2024, the Taiwan Taiex Index posted a remarkable 27.27% growth, fueled by investor confidence and a booming tech sector. The Hang Seng Index (+19.18%) and Shanghai SE Composite (+10.25%) also recorded strong gains, reflecting a recovery in Chinese markets. The Nifty 50 (+11.4%) showed moderate growth, highlighting India’s resilience despite global volatility. However, the Kospi Index declined by 4.00%, underperforming the region. This divergence can explain why the Islamic Asia Pacific Index underperformed the conventional index. The Islamic index’s heavier weight in South Korea, where the market struggled, and its underweight in China, where markets performed well, contributed to the weaker returns compared to the conventional index.
When considering where to invest—whether in an Asia conventional fund or a Shariah-compliant fund—the answer ultimately depends on several factors. For some investors, Shariah compliance is non-negotiable, meaning they cannot invest in conventional funds. However, for others, the decision may come down to market conditions and the fund’s performance in a given year. Market dynamics vary annually; one region may outperform this year but underperform the next, making it difficult to predict which strategy will consistently deliver the best results.
Ultimately, the choice should circle back to the investor’s objectives. Whether the focus is on long-term growth, ethical considerations, or a particular market segment, investors should select the fund that aligns with their specific goals and values. This approach ensures that the investment decision is well-suited to both personal beliefs and financial objectives.
Investors seeking Asia exposure can consider our Managed UT Portfolio, which includes PMART UT, PMA UT, and PMART UT Flexi for targeted investment opportunities. Our portfolio is available in both Conventional and Shariah options. Please click on the link to learn more or email us at cse.my@phillipcapital.com.my if you require any further information.
Disclaimer:
The information contained herein does not constitute an offer, invitation or solicitation to invest in Phillip Capital Management Sdn Bhd (“PCM”). This article has been reviewed and endorsed by the Executive Director (ED) of PCM. This article has not been reviewed by The Securities Commission Malaysia (SC). No part of this document may be circulated or reproduced without prior permission of PCM. This is not a collective investment scheme / unit trust fund. Any investment product or service offered by PCM is not obligations of, deposits in or guaranteed by PCM. Past performance is not necessarily indicative of future returns. Investments are subject to investment risks, including the possible loss of the principal amount invested. Investors should note that the value of the investment may rise as well as decline. If investors are in any doubt about any feature or nature of the investment, they should consult PCM to obtain further information including on the fees and charges involved before investing or seek other professional advice for their specific investment needs or financial situations. Whilst we have taken all reasonable care to ensure that the information contained in this publication is accurate, it does not guarantee the accuracy or completeness of this publication. Any information, opinion and views contained herein are subject to change without notice. We have not given any consideration to and have not made any investigation on your investment objectives, financial situation or your particular needs. Accordingly, no warranty whatsoever is given and no liability whatsoever is accepted for any loss arising whether directly or indirectly as a result of any persons acting on such information and advice.